SIA U1C · Websites, apps and AI · Latvia+371 28786828[email protected]Latviski
Get a quote

Dashboards and data analytics

Good decisions need numbers people trust. When your data lives in several systems, bringing it together automatically gives everyone the same clear picture.

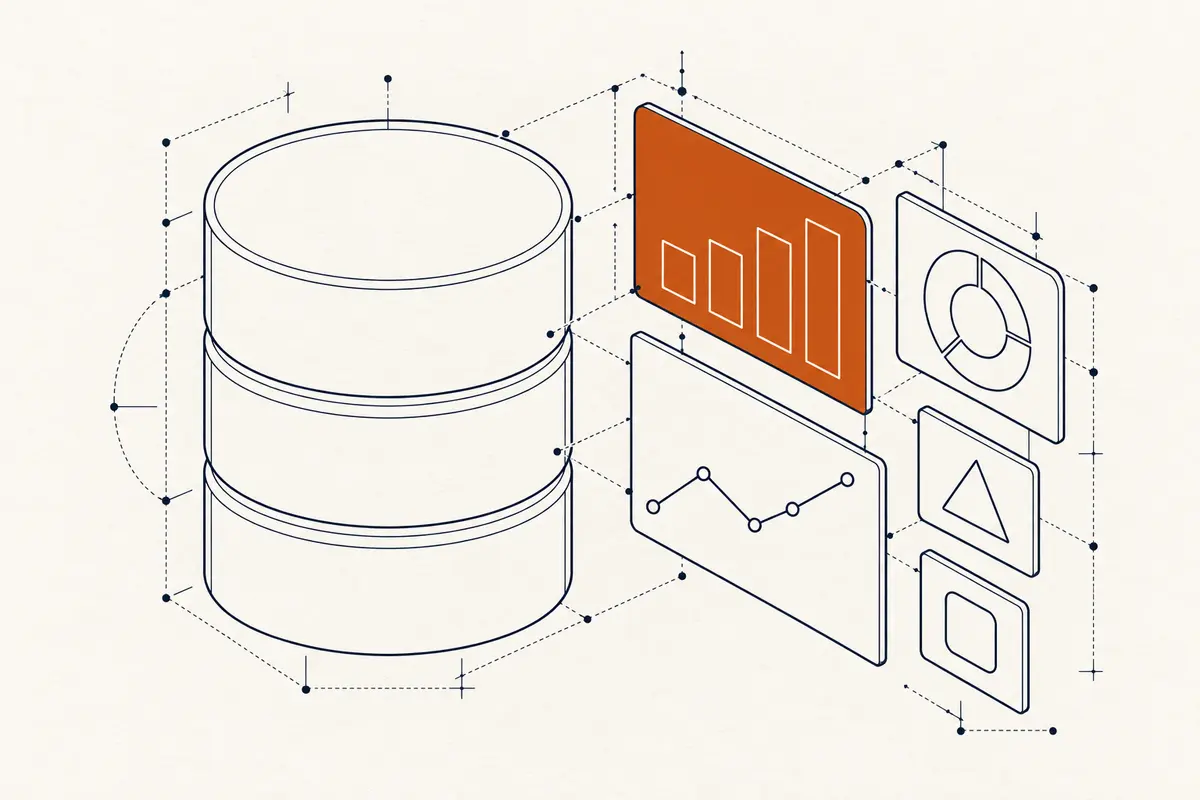
We connect your data, build clear dashboards and show where each number comes from.
What you get

  • Key numbers in one place, updated automatically
  • Reports prepared automatically, saving hours of work
  • Every number traceable to where it came from
  • Views for management, teams and clients

A good fit when

  • You want monthly reports built automatically from several sources
  • You want everyone to get the same numbers for the same question
  • You have data and want a clear view of it

How it works

  1. Step 1

    Questions first

    We agree which questions the numbers must answer.

  2. Step 2

    Connect data

    We connect the sources and clean the data.

  3. Step 3

    Build views

    We design simple charts and tables that answer those questions.

  4. Step 4

    Automate

    Updates run on a schedule and alert you to unusual changes.

For technical teams
  • Data pipelines from databases, APIs, spreadsheets and files
  • Documented metric definitions and source links
  • Scheduled refresh, alerts and export
  • Public-data analytics experience, including Latvian open data

Questions

Do we need a data warehouse?

Small and mid-size companies can often start with their existing systems.

Can clients see their own reports?

Yes. Dashboards can be shared with clients, each seeing only their data.

Talk to us about your project

Call or write. We reply within one working day.